By the Numbers
Discover EECS through some of the facts and figures that describe our faculty, students and alumni, and see how our academic programs compare to those in other institutions.
Faculty
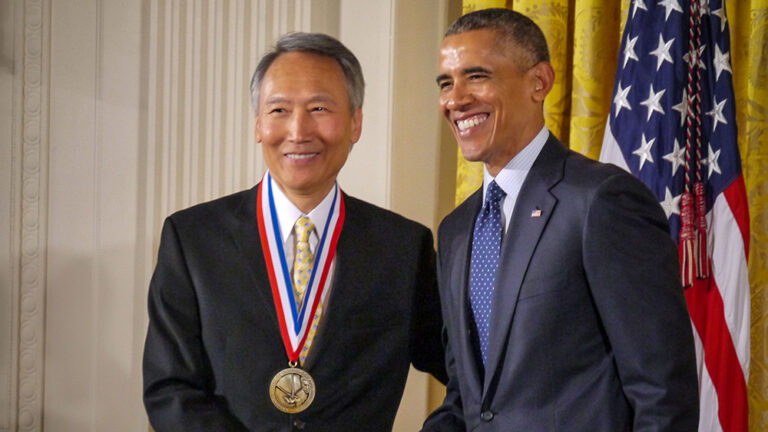
- 1 National Medal of Science
- 1 National Medal of Technology and Innovation
- 40 ACM Fellows and 6 ACM A.M. Turing Awards
- 71 IEEE Fellows and 1 IEEE Medal of Honor
- 32 National Academy of Engineering Members
- 14 National Academy of Sciences Members
- 21 American Association for the Advancement of Science Fellows
- 23 American Academy of Arts & Sciences Members
- 44 Sloan Research Fellows
- 15 Berkeley Distinguished Teaching Award Recipients
- 18 Berkeley Citations
- 2 MacArthur Fellows
This is just a small sample of the many awards received by current and emeriti EECS faculty.
Research
- Number of research areas: 20
- Number of EECS-affiliated centers and labs: over 70
- Many interdisciplinary projects including collaborations with
- Other departments at Cal: Berkeley Center for New Media, Biochemistry, Bioengineering, Economics, Industrial Engineering and Operations Research, Integrative Biology, International Computer Science Institute, Lawrence Berkeley National Lab, Mathematics, Mechanical Engineering, Neuroscience, Physics, Psychology, School of Information, School of Optometry, and Statistics
- Government agencies: Air Force Office of Scientific Research (AFOSR), Army Research Office (ARO), California Department of Justice, Defense Advanced Research Projects Agency (DARPA), Department of Defense (DOD), Department of Energy (DOE), Federal Trade Commission (FTC), Multidisciplinary University Research Initiatives (MURI), National Institute of Health (NIH), National Science Foundation (NSF), and Office of Naval Research (ONR)
- Other universities: CMU, GaTech, Johns Hopkins, MIT, Penn State, Stanford, TU Berlin, UC San Diego, UC Santa Cruz, UIUC, UMD, UMich, University of Colorado Boulder, UT Austin, and UWash
- Private companies: AMD, AT&T, Cray, Denso Corp, Globalfoundries, Google, HP, IBM, Intel, Mathworks, MEARS Technologies, Microelectronics Advanced Research Corp (MARCO), Micron Technology, National Instruments, National Semiconductor, Nokia, nVidia, Oracle, Pixar, Raytheon, Samsung, SRC, Sumitomo Electric Ltd, Sun Microsystems, Synopsys, Texas Instruments, Toyota, and Willow Garage Inc
- Open source communities
US News Undergraduate Rankings
EECS Total Enrollment/College and Campus Comparison (Fall 2023)
EECS Total Undergraduate Student Enrollment: 1,720
Computer Science Total Undergraduate Student Enrollment: 2,022
UC Berkeley Total Undergraduate Student Enrollment: 33,078
EECS Total Graduate Student Enrollment: 741
UC Berkeley Total Graduate Student Enrollment: 12,621
Demographics
| EECS Total Undergraduate Enrollment (Fall 2023) | Computer Science Total Undergraduate Enrollment (Fall 2023) | UC Berkeley Total Undergraduate Enrollment (Fall 2023) | EECS Total Grad Enrollment (Fall 2023) | UC Berkeley Total Grad Enrollment (Fall 2023) | |
|---|---|---|---|---|---|
| CA Resident | 70% | 60% | 77% | 44% | 41% |
| Domestic Non-resident | 16% | 18% | 11% | 9% | 31% |
| International | 14% | 22% | 12% | 48% | 14% |
| Female | 23% | 27% | 55% | 23% | 48% |
| Male | 75% | 72% | 43% | 75% | 50% |
| Underrepresented Minority (URM)* | 14% | 5% | 25% | 6% | 29% |
| Non-URM | 78% | 63% | 60% | 46% | 14% |
| First-generation (4-year degree) | 25% | 14% | 31% | N/A | N/A |
| Pell Grant Recipient | 18% | 15% | 27% | N/A | N/A |
| Grant Recipient | 31% | 18% | 43% | N/A | N/A |
| International/Degree Status-ineligible | 14% | 22% | 12% | 48% | 32% |
Last updated: April 25, 2024
*URM refers to African American, Chicano/Latino, Native American/Alaska Native, and Pacific Islander. International students are not included in the URM data.
Curriculum
- Number of degree programs: 5 (BA, BS, MS, MEng, PhD)
- Ranking for Best Blockchain University by CoinDesk: 2
- CS 61A named one of the Five Best Computer Science Classes in the US by Bloomberg News